Labour Force Survey Monthly
Labour Force Survey, January 2026
released February 6, 2026
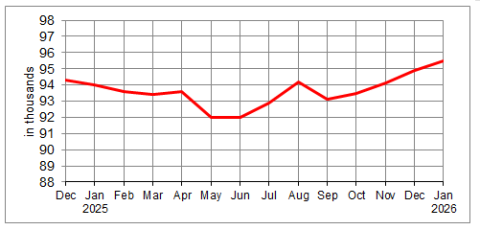
Prince Edward Island Employment
Unemployment Rate By Province (seasonally adjusted, in percentage)
| Month | Can | NL | PE | NS | NB | QC | ON | MB | SK | AB | BC |
| January 2026 | 6.5 | 9.2 | 7.6 | 6.9 | 6.7 | 5.2 | 7.3 | 6.3 | 5.3 | 6.4 | 6.1 |
| December 2025 | 6.8 | 10.5 | 7.1 | 6.4 | 6.5 | 5.3 | 7.9 | 5.7 | 6.4 | 6.7 | 6.3 |
| January 2025 | 6.7 | 10.4 | 7.3 | 6.1 | 6.4 | 5.5 | 7.6 | 6.1 | 5.2 | 6.8 | 6.0 |
| Year-over-year change (pp) | -0.2 | -1.2 | 0.3 | 0.8 | 0.3 | -0.3 | -0.3 | 0.2 | 0.1 | -0.4 | 0.1 |
| Monthly change (pp) | -0.3 | -1.3 | 0.5 | 0.5 | 0.2 | -0.1 | -0.6 | 0.6 | -1.1 | -0.3 | -0.2 |
Summary
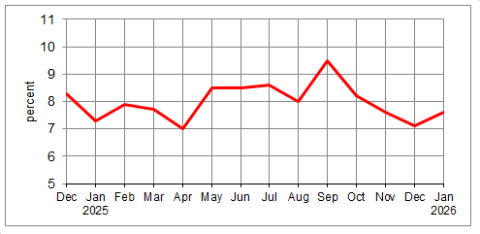
Statistics Canada’s LFS shows P.E.I.’s seasonally adjusted employment increased 1,500 from one year ago to reach an all-time high of 95,500 in January 2026. This is an increase of 600 from last month. The seasonally adjusted unemployment rate was 7.6 percent, up 0.3 percentage points from January 2025 and up 0.5 percentage points from last month. The total labour force totaled 103,400 in January. This is up 2,000 (2.0 percent) compared to January 2025 and up 1,200 (1.2 percent) compared to December 2025. The participation rate was 66.5 percent in January, up 0.7 percentage points from December.
The year-over-year increase in employment was due to an increase of 500 (0.6 percent) in full-time employment, while part-time employment increased by 1,000 (7.7 percent). Full-time employment totaled 81,500 in January, while part-time employment was 14,000. The services sector saw an increase of 3,800 as compared to January 2025, while employment in the goods-producing sector declined by 2,200 over the same period (see table below for year-over-year employment gains and losses by industry), to total 72,400 and 23,200 respectively.
Employment gains (+)/ losses (-) between January 2025 and January 2026 occurred in the following sectors on Prince Edward Island1:
| Goods-producing sector | -2,200 | Service-providing sector | 3,800 | |
| Agriculture | 0 | Trade (Retail/Wholesale) | -100 | |
| Other Primary Industries | -1,300 | Transport & Warehousing | -400 | |
| Manufacturing | -1,200 | Finance, Insurance, Real Estate | 900 | |
| Construction | 0 | Business Services | -600 | |
| Utilities | 300 | Professional, Scientific and Technical | 1,100 | |
| Educational Services | -200 | |||
| Health & Social Services | 1,700 | |||
| Public Administration | -200 | |||
| Information, Culture and Recreation | 1,100 | |||
| Accommodation & Food services | 800 | |||
| Other Services | -200 |
The number of unemployed persons in January on Prince Edward Island was 7,900, up 600 from one month ago and up 500 as compared to January 2025. Long-term unemployment—the number of people who had been continuously unemployed for 27 weeks or more—was 1,500 in January, down from 1,800 in December. Expressed as a proportion of the total labour force, long-term unemployment was 1.5 percent in January, down from 1.8 percent in December.
PEI Unemployment Rate (Seasonally Adjusted)
According to the Labour Force Survey, year-over-year growth in PEI’s population aged 15 years and older was 2.0 percent in January. The employment rate—the proportion of the population aged 15 years and older who are employed—can help assess whether employment growth is keeping pace with population growth. In January, PEI’s employment rate was 61.5 percent, down 0.2 percentage points from January 2025. This indicates that growth in the population aged 15 years and over has outpaced growth in employment year-over-year. The employment rate was at an all-time high of 63.1 percent in September 2023.
The three-month moving average unemployment rate used by the Employment Insurance program for the Charlottetown region was 6.6 percent in January, down from 6.8 percent in December. The minimum draw period and hours needed to qualify remain at 15 weeks and 665 hours for this region. The rate in the PEI region in January was 8.9 percent, down from 9.1 percent in December. The minimum draw period falls from 20 to 18 weeks and hours needed to qualify increase from 560 to 595 for this region. For more information, please refer to Employment Insurance (EI) - Canada.ca.
NATIONAL
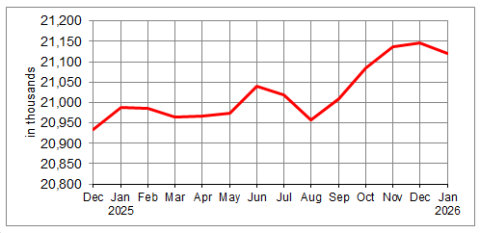
Nationally, employment decreased by 25,000 in January 2026 as compared to December 2025 and the unemployment rate decreased 0.3 percentage point to 6.5 percent, as there were fewer people looking for work. The employment rate decreased 0.1 percentage point to 60.8 per cent in January.
At the industry level, employment in the goods-producing sector decreased by 3,800 (-0.1 percent) as compared to last month, while employment in the services-producing sector fell by 21,000 (-0.1 percent).
Provincially, seasonally adjusted employment in January decreased only in Ontario (-0.8 percent), with notable increases in Alberta (0.8 percent), Saskatchewan (1.0 percent), and Newfoundland and Labrador (1.6 percent).
National average hourly wages for employees rose 3.3 percent ($1.18) on a year-over-year basis in January. By province, year-over-year wage growth was highest in January in Nova Scotia (5.4 percent; $1.73), Prince Edward Island (4.9 percent; $1.49) and Quebec (4.8 percent; $1.65). Saskatchewan saw a slight year-over-year decrease in the average hourly wage (-0.1 percent; -$0.03). PEI’s average hourly wage remains the lowest among provinces at $31.60 in January.
Unadjusted for seasonality, the national three-month moving average unemployment rate in January was 6.4 percent. The rate for population groups designated as visible minorities was 8.0 percent. Visible minority groups for which the rate was higher than the average were Black Canadians at 11.1 percent, Arab Canadians at 11.1 per cent, Japanese Canadians at 9.9 per cent, and West Asian Canadians at 9.2 percent.
Canada Employment
1 Components may not sum to total due to rounding
Notes:
1. The LFS estimates for January are for the week of January 11 to 17.
2. The LFS estimates are based on a sample and are therefore subject to sampling variability. For more information, see the Statistics Canada publication "Interpreting Monthly Changes in Employment from the Labour Force Survey."
3. The next release of the LFS will be on March 13, 2026.
4. The standard annual revision to LFS data was released on January 26, 2026. These revisions resulted in minor changes to recent and historical LFS data and had little impact on trends in key labour market indicators, such as employment, unemployment, and labour force participation rates.
Source: Statistics Canada, Labour Force Survey Estimates, released January 9, 2026.
For more information and links to data tables, refer to the Statistics Canada Labour Force Survey release for January 2026.
Related downloads for this release:
Monthly Labour Force Survey report - PDF (100KB)