Labour Force Survey Monthly
Labour Force Survey, December 2025
released January 9, 2026
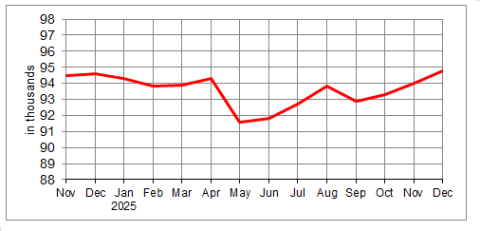
Prince Edward Island Employment
Unemployment Rate By Province (seasonally adjusted, in percentage)
| Month | Can | NL | PE | NS | NB | QC | ON | MB | SK | AB | BC |
| December 2025 | 6.8 | 10.7 | 7.3 | 6.5 | 6.6 | 5.4 | 7.9 | 5.7 | 6.5 | 6.8 | 6.4 |
| November 2025 | 6.5 | 10.4 | 7.7 | 6.7 | 6.6 | 5.1 | 7.3 | 6.1 | 5.6 | 6.5 | 6.4 |
| December 2024 | 6.7 | 10.5 | 8.5 | 6.3 | 7.7 | 5.6 | 7.5 | 6.2 | 6.0 | 6.7 | 5.9 |
| Year-over-year change (pp) | 0.1 | 0.2 | -1.2 | 0.2 | -1.1 | -0.2 | 0.4 | -0.5 | 0.5 | 0.1 | 0.5 |
| Monthly change (pp) | 0.3 | 0.3 | -0.4 | -0.2 | 0.0 | 0.3 | 0.6 | -0.4 | 0.9 | 0.3 | 0.0 |
Summary
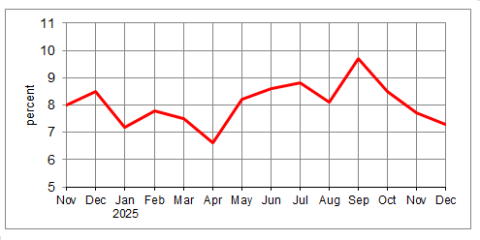
Statistics Canada’s LFS shows P.E.I.’s seasonally adjusted employment in December totaled 94,800, a new all-time high. This is up 200 from one year ago and up 800 from last month. The seasonally adjusted unemployment rate was 7.3 percent, down 1.2 percentage points as compared to December 2024 and down 0.4 percentage points compared to November 2025. The total labour force was 102,300 in December, down 1,100 (-1.1 percent) compared to December 2024 and up 500 (0.5 percent) compared to November 2025. The participation rate was 65.9 percent in December, up 0.3 percentage points from November.
Employment in December increased by 1.5 percent for people aged 25 and over as compared to November 2025, while employment for youth aged 15 to 24 fell 2.8 percent. Year-over-year, youth employment has dropped by 9.1 percent, compared to an increase of 2.0 percent for the 25 and over age group over this period.
Year-over-year full-time employment increased by 2,600 (3.3 percent), while part-time employment fell by 2,400 (-15.2 percent). Full-time employment totaled 81,400 in December, while part-time employment was 13,400.
The services sector saw an increase of 1,400 (2.0 percent) as compared to December 2024, while employment in the goods-producing sector fell by 1,100 (-4.5 percent) over the same period to total 71,300 and 23,600 respectively.
Employment gains (+)/ losses (-) between December 2024 and December 2025 occurred in the following sectors on Prince Edward Island1:
| Goods-producing sector | -1,100 | Service-providing sector | 1,400 | |
| Agriculture | -400 | Trade (Retail/Wholesale) | -100 | |
| Other Primary Industries | 0 | Transport & Warehousing | -200 | |
| Manufacturing | -700 | Finance, Insurance, Real Estate | 1,100 | |
| Construction | -500 | Business Services | -300 | |
| Utilities | 400 | Professional, Scientific and Technical | 700 | |
| Educational Services | -100 | |||
| Health & Social Services | 1,700 | |||
| Public Administration | -700 | |||
| Information, Culture and Recreation | -200 | |||
| Accommodation & Food services | 300 | |||
| Other Services | -900 |
The number of unemployed people in December on Prince Edward Island was 7,500, down 300 from one month ago and down 1,300 as compared to December 2024. Long-term unemployment—the number of people who were continuously unemployed for 27 weeks or more—was 1,800 in December, up from 1,200 in November. Expressed as a proportion of the total labour force, long-term unemployment was 1.8 percent in December, up from 1.2 percent in November.
PEI Unemployment Rate (Seasonally Adjusted)
According to the Labour Force Survey, year-over-year growth in PEI’s population aged 15 years and older was 1.9 percent in December. The employment rate—the proportion of the population aged 15 years and older who are employed—can help assess whether employment growth is keeping pace with population growth. In December, PEI’s employment rate was 61.0 percent, down 1.1 percentage points from December 2024. This indicates that growth in population year-over-year has outpaced employment growth over this period. The employment rate was at an all-time high of 63.0 percent in September and October of 2023.
The three-month moving average unemployment rate used by the Employment Insurance program for the Charlottetown region was 6.8 percent in December, down from 7.3 percent November. The minimum draw period falls from 17 to 15 weeks and hours needed to qualify increase from 630 to 665 for this region. The rate in the PEI region in December was 9.1 percent, down from 10.0 percent in November. The minimum draw period and hours needed to qualify remain at 20 weeks and 560 hours for this region. For more information, please refer to Employment Insurance (EI) - Canada.ca.
NATIONAL
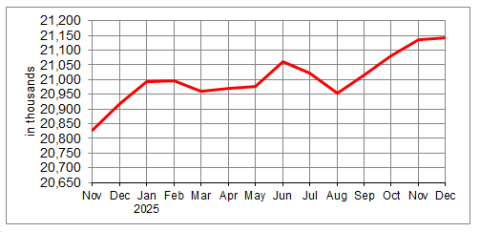
Nationally, there was little change in employment in December 2025 as compared to November 2025 (+8,200). The unemployment rate rose 0.3 percentage points to 6.8 percent as there were more people looking for work. The national employment rate remained at 60.9 percent in December.
At the industry level, employment in the goods-producing sector increased by 8,000 (0.2 percent), with no change in the services-producing sector, as compared to November. Provincially, seasonally adjusted employment in December rose in 5 provinces with the largest percentage increases occurring in Prince Edward Island (0.9%), Quebec (0.3%), and Manitoba (0.3 percent). The largest decreases occurred in New Brunswick (-0.6%) and Saskatchewan (-0.6%).
National average hourly wages for employees rose 3.4 percent ($1.23) on a year-over-year basis in December to reach $37.06. By province, year-over-year wage growth was highest in December in Nova Scotia (6.8 percent; $2.14), Quebec (5.0 percent; $1.70), and British Columbia (4.6 percent; $1.68). PEI’s average hourly wage increased 3.3 percent ($1.02) year-over-year in December, however remains the lowest among provinces at $31.58.
Unadjusted for seasonality, the national three-month moving average unemployment rate in December was 6.3 percent. The rate for population groups designated as visible minorities was 7.8 percent. Visible minority groups for which the rate was higher than the average were Black Canadians at 10.9 percent, Arab Canadians at 10.4 per cent, Japanese Canadians at 9.9 percent, West Asian Canadians at 8.3 percent, and Korean Canadians at 7.9 percent.
Canada Employment
1 Components may not sum to total due to rounding
Notes:
1. The LFS estimates for December are for the week of December 7 to 13, 2025.
2. The LFS estimates are based on a sample and are therefore subject to sampling variability. For more information, see the Statistics Canada publication "Interpreting Monthly Changes in Employment from the Labour Force Survey."
3. The next release of the LFS will be on February 6, 2026.
Source: Statistics Canada, Labour Force Survey Estimates, released January 9, 2026.
For more information and links to data tables, refer to the Statistics Canada Labour Force Survey release for December 2025.
Related downloads for this release:
Monthly Labour Force Survey report - PDF (100KB)