PEI Population Report Quarterly
Population Report, Third Quarter 2025
DIAGRAM 1: PRINCE EDWARD ISLAND POPULATION, QUARTERLY, 2021 - 2025
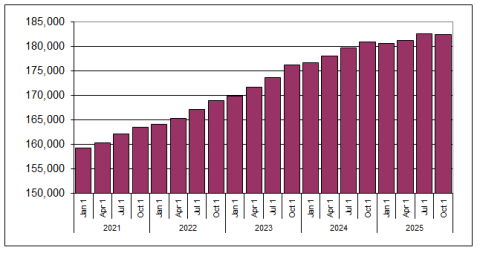
On December 17, 2025 Statistics Canada published its provincial population estimates for the third quarter of 2025. The data shows Prince Edward Island’s population was estimated to be 182,508 as of October 1, 2025. This represents a yearly increase of 1,631 or 0.9 percent. This is the third highest year-over-year growth rate among provinces and territories, behind Alberta (1.7%) and Nunavut (1.0%). PEI’s year-over-year population growth has slowed in each of the past eight quarters, after reaching an all-time high of 4.3 percent during the third quarter of 2023.
Canada’s population was 41,575,585 as of October 1, 2025, an increase of 0.2 percent over one year ago.
The quarterly estimates since July 1, 2023 and growth rates for Canada and Prince Edward Island can be seen in Table 1.
TABLE 1: NATIONAL AND PROVINCIAL POPULATION & GROWTH RATES, QUARTERLY
| Canada | Prince Edward Island | |||
| Quarter | Population | Growth rate (%) | Population | Growth rate (%) |
| Jul. 1, 2023 | 40,049,088 | 0.8 | 173,734 | 1.2 |
| Oct. 1, 2023 | 40,467,722 | 1.0 | 176,173 | 1.4 |
| Jan. 1, 2024 | 40,724,526 | 0.6 | 176,757 | 0.3 |
| Apr. 1, 2024 | 40,990,297 | 0.7 | 178,022 | 0.7 |
| Jul. 1, 2024 | 41,262,329 | 0.7 | 179,709 | 0.9 |
| Oct. 1, 2024 | 41,494,132 | 0.6 | 180,877 | 0.6 |
| Jan. 1, 2025 | 41,574,517 | 0.2 | 180,686 | -0.1 |
| Apr. 1, 2025 | 41,604,555 | 0.1 | 181,289 | 0.3 |
| Jul. 1, 2025 | 41,651,653 | 0.1 | 182,657 | 0.8 |
| Oct. 1, 2025 | 41,575,585 | -0.2 | 182,508 | -0.1 |
Eight provinces and all three territories saw year-over-year population increases for October 1, 2025 compared to October 1, 2024. Decreases occurred in Ontario (-0.2%) and British Columbia (-0.2%). Population estimates for October 1, 2024 and 2025 for all provinces and territories are shown in Table 2 below. The population growth rates and level change for the twelve-month period ending September 30, 2025 are also included.
TABLE 2: POPULATION OF PROVINCES & TERRITORIES, OCTOBER 1, 2024, 2025 & ANNUAL GROWTH RATES
| Oct 1, 2024 | Oct 1, 2025 | Growth | Level | |
| CAN | 41,494,132 | 41,575,585 | 0.2% | 81,453 |
| NL | 548,402 | 549,738 | 0.2% | 1,336 |
| PEI | 180,877 | 182,508 | 0.9% | 1,631 |
| NS | 1,088,273 | 1,091,857 | 0.3% | 3,584 |
| NB | 863,841 | 868,630 | 0.6% | 4,789 |
| QC | 9,038,268 | 9,058,089 | 0.2% | 19,821 |
| ON | 16,228,152 | 16,191,372 | -0.2% | -36,780 |
| MB | 1,500,464 | 1,507,057 | 0.4% | 6,593 |
| SK | 1,256,983 | 1,266,234 | 0.7% | 9,251 |
| AB | 4,957,075 | 5,040,871 | 1.7% | 83,796 |
| BC | 5,696,852 | 5,683,201 | -0.2% | -13,651 |
| YK | 47,939 | 48,261 | 0.7% | 322 |
| NWT | 45,520 | 45,848 | 0.7% | 328 |
| NU | 41,486 | 41,919 | 1.0% | 433 |
Components of Growth
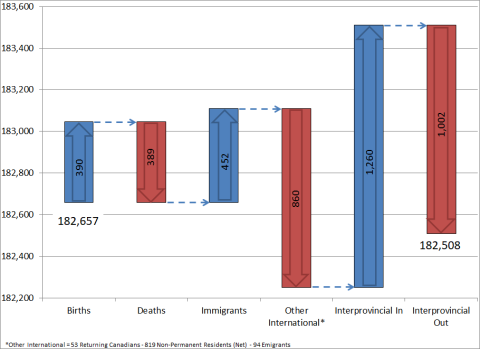
PEI’s population declined by 149 people during the third quarter of 2025 (July 1, 2025 to September 30, 2025).
Natural Increase
There were 390 births and 389 deaths on Prince Edward Island from over this period, resulting in natural growth (births minus deaths) of +1. Over the last 12-month period, deaths have outpaced births by 245.
International Migration
During third quarter of 2025, 452 international immigrants came to the province, down from 544 during the second quarter. At a rate of 2.5 per thousand , the province had the seventh highest quarterly immigration rate in the country. The immigration rate for Canada was also 2.5 per thousand.
Net international migration was estimated to be -408 people during the third quarter of 2025, the first time PEI’s net international migration has been negative since the fourth quarter of 2003. This consisted of the aforementioned 452 international immigrants, plus 709 new non-permanent resident (NPR) permits issued and 53 returning Canadians entering the province, while 1,528 NPR permits expired and 94 international emigrants left the province. Net international migration for PEI over the last 12-month period (October 2024 to September 2025) was 363. This compares to 4,269 over the previous 12-month period.
It was estimated that there were 709 new non-permanent resident permits issued for PEI during the third quarter of 2025, while 1,528 NPR permits expired, for a net change of -819. As of October 1, 2025, there were 11,044 NPRs on PEI consisting of 6,540 work permit holders, 3,310 study permit holders, 662 with both work and study permits, 380 other permit holders, and 152 asylum claimants. NPRs include foreign workers, foreign students, the humanitarian population and other temporary residents. The humanitarian population includes refugee claimants and temporary residents who are allowed to remain in Canada on humanitarian grounds and are not categorized as either foreign workers or foreign students.
Inter-provincial Migration
A total of 1,260 inter-provincial migrants came to PEI during the third quarter of 2025, while 1,002 people left the province for other areas of Canada, for a net interprovincial gain of 258. This compares to a net loss of 212 persons over the same period in 2024. As shown in Table 3, the primary source of PEI’s inter-provincial in-migrants during this period was from Ontario, followed by Quebec and British Columbia. The main destinations of out-migrants from Prince Edward Island were Ontario, Alberta, and Nova Scotia. Ontario gained the most from inter-provincial migration, with 35.3 percent of all interprovincial migrants from other provinces destined for Alberta.
TABLE 3: ORIGIN & DESTINATION OF INTER-PROVINCIAL MIGRANTS, JULY 1, 2025 TO SEPTEMBER 30, 2025
| DESTINATION | |||||||||||||
| ORIGIN | N.L. | P.E.I. | N.S. | N.B. | Que. | Ont. | Man. | Sask. | Alta. | B.C. | Y.T. | N.W.T. | Nvt. |
| N.L. | 0 | 48 | 108 | 175 | 71 | 407 | 20 | 11 | 405 | 360 | 17 | 14 | 22 |
| P.E.I. | 19 | 0 | 199 | 28 | 108 | 338 | 32 | 0 | 209 | 69 | 0 | 0 | 0 |
| N.S. | 128 | 130 | 0 | 381 | 140 | 1,854 | 47 | 63 | 701 | 451 | 24 | 20 | 29 |
| N.B. | 6 | 81 | 549 | 0 | 950 | 1,237 | 98 | 72 | 734 | 289 | 10 | 10 | 19 |
| Que. | 50 | 201 | 375 | 503 | 0 | 5,203 | 422 | 184 | 961 | 1,002 | 63 | 17 | 4 |
| Ont. | 568 | 529 | 1,955 | 1,353 | 3,772 | 0 | 1,350 | 1,045 | 5,641 | 4,065 | 66 | 98 | 40 |
| Man. | 89 | 21 | 83 | 99 | 249 | 1,736 | 0 | 343 | 1,611 | 794 | 0 | 5 | 4 |
| Sask. | 34 | 8 | 83 | 42 | 77 | 1,227 | 273 | 0 | 2,195 | 912 | 15 | 0 | 0 |
| Alta. | 255 | 100 | 365 | 312 | 683 | 3,720 | 600 | 1,005 | 0 | 5,247 | 73 | 112 | 41 |
| B.C. | 131 | 142 | 665 | 216 | 622 | 3,520 | 671 | 593 | 5,409 | 0 | 40 | 34 | 0 |
| Y.T. | 0 | 0 | 5 | 14 | 0 | 98 | 0 | 0 | 80 | 178 | 0 | 20 | 0 |
| N.W.T. | 13 | 0 | 18 | 0 | 29 | 67 | 14 | 18 | 191 | 174 | 9 | 0 | 6 |
| Nvt. | 0 | 0 | 4 | 11 | 16 | 103 | 20 | 10 | 28 | 6 | 16 | 4 | 0 |
| N.L. | P.E.I. | N.S. | N.B. | Que. | Ont. | Man. | Sask. | Alta. | B.C. | Y.T. | N.W.T. | Nvt. | |
| IN | 1,293 | 1,260 | 4,409 | 3,134 | 6,717 | 19,510 | 3,547 | 3,344 | 18,165 | 13,547 | 333 | 334 | 165 |
| OUT | 1,658 | 1,002 | 3,968 | 4,055 | 8,985 | 20,482 | 5,034 | 4,866 | 12,513 | 12,043 | 395 | 539 | 218 |
| NET | -365 | 258 | 441 | -921 | -2,268 | -972 | -1,487 | -1,522 | 5,652 | 1,504 | -62 | -205 | -53 |
Prince Edward Island quarterly components of growth from April 1, 2023 to October 1, 2025 can be seen in table 4.
TABLE 4: PRINCE EDWARD ISLAND QUARTERLY POPULATION AND COMPONENTS OF GROWTH APRIL 1 2023 – OCTOBER 1 2025
| Quarter | Population | (+) Births | (-) Deaths | (+) Immigrants | (+) Other International* | (+) Interprovincial In-Migration | (-) Interprovincial Out-Migration |
| Apr 1, 2023 | 171,736 | 289 | 375 | 694 | 897 | 1,918 | 1,425 |
| Jul 1, 2023 | 173,734 | 362 | 366 | 826 | 1,483 | 1,261 | 1,127 |
| Oct 1, 2023 | 176,173 | 341 | 434 | 824 | -106 | 747 | 788 |
| Jan 1, 2024 | 176,757 | 349 | 409 | 1,328 | -313 | 1,368 | 1,058 |
| Apr 1, 2024 | 178,022 | 328 | 380 | 1,169 | -12 | 1,932 | 1,350 |
| Jul 1, 2024 | 179,709 | 371 | 370 | 980 | 399 | 837 | 1,049 |
| Oct 1, 2024 | 180,877 | 300 | 440 | 502 | -372 | 444 | 625 |
| Jan 1, 2025 | 180,686 | 363 | 420 | 817 | -694 | 1,389 | 852 |
| Apr 1, 2025 | 181,289 | 341 | 390 | 544 | -26 | 2,237 | 1,338 |
| Jul 1, 2025 | 182,657 | 390 | 389 | 452 | -860 | 1,260 | 1,002 |
| Oct 1, 2025 | 182,508 | ||||||
DIAGRAM 2: PEI COMPONENTS OF GROWTH JULY 1 2025 – SEPTEMBER 30 2025
Related downloads for this release:
PEI Population Report Quarterly PDF (179KB)
Notes:
These are preliminary data that will be revised over the coming year.
These estimates are based on 2021 Census of Population counts, adjusted for census net undercoverage and incompletely enumerated Indian reserves. To these counts, the population growth estimates for the period from May 11, 2021, to the date of the estimate are added.
1 Immigration rates are calculated by the PEI Statistics Bureau based on Statistics Canada population estimates.
Source: Statistics Canada
Table 17-10-0009-01, Estimates of population, Canada, provinces and territories, quarterly
Table 17-10-0020-01, Interprovincial migrants, Canada, provinces and territories, quarterly
Table 17-10-0121-01, Estimates of the number of non-permanent residents by type, quarterly
Prepared by PEI Statistics Bureau