Soil Health Test - How to Interpret Your Results
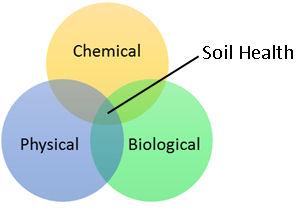
“Soil health” is a term often used to define the ability of a soil to function. It focuses on all three primary soil properties: the physical, chemical, and biological components and how they affect plant productivity. By testing soil health parameters, we can better understand the limitations and stressors to a soil system, and try to adapt management practices to increase the areas that require improvement.
The chemical, biological, and physical properties of soil work cohesively together. By neglecting one aspect of soil health, you could be limiting other areas.
Section I - Soil health indicator tests
Each soil health test listed below is a useful indicator of one or more soil functions. The active carbon, soil respiration, aggregate stability, and soil texture tests were adapted from the Cornell Soil Health Assessment and Atlantic Soil Health Lab. The biological nitrogen availability test was adapted from the Atlantic Soil Health Lab.
Soil Texture
Soil texture is presented as the percentage of sand, silt, and clay particles found in a soil. Based on those results, your soil falls into one of several soil texture classes. . There is no rating associated with soil texture results since texture cannot be altered or influenced through management practices. Generally, soil texture class will not change over time.
Soil texture can strongly influence many soil characteristics, such as the amount of soil organic matter that a soil could potentially contain. Therefore, soil texture can influence soil health test results. With sandy soils like those found on PEI, it can be difficult to build and maintain high levels of soil organic matter, which has the potential to decline faster than other soil types in response to crop management practices. On the other hand, sandy soils generally have better drainage than heavier clay soils.
Soil Organic Matter
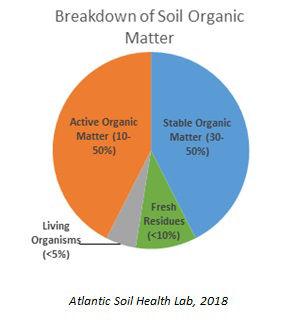
One of the best indicators of soil health is soil organic matter content. Soil organic matter, measured as total soil carbon, represents the amount of carbon compounds in the soil that are derived from living and dead organisms and plant tissues. Organic matter exists in various stages of decomposition and is considered vital to soil health because it influences almost every important soil property, including fertility, nutrient cycling, water storage and infiltration, and extreme weather events.
The total soil organic matter value is reported as a percentage of the overall soil amount. The higher the value - the better.
It can take several years to notice an increasing or decreasing trend in soil organic matter levels beyond lab or field variability. This is partially due to the fact that a relatively large portion of soil organic matter is highly inactive and has taken thousands of years to form.
Active Carbon
Soil organic matter can be divided into two different groups: the “stable” fraction and the “active” fraction. The “stable” (or “humus”) fraction has formed over thousands of years, is resistant to breakdown, and not usable by plants. It stores carbon and provides an essential role in maintaining soil structure and cation exchange capacity. The “active” soil organic matter fraction is more recently formed (1-5 years) and is more readily available to plants. The active fraction consists of decomposing plant and animal (microbe) tissues and acts to supply and recycle soil nitrogen. The active fraction is also involved in the formation of soil aggregates. The active soil organic matter fraction responds more quickly to crop management changes than the much larger stable soil organic matter in soil. Therefore, being able to evaluate the amount of active carbon is useful for measuring and tracking the impact of soil management practices on organic matter.
For the active carbon test, the higher the value - the better.
Soil Respiration
Microbes, including bacteria and fungi, play a critical role in regulating the carbon cycle and mineralizing nutrients, turning them into plant-available forms. Soil microbes also influence tilth (soil structure) and help protect crops against pests and disease. As the name implies, the soil respiration test assesses microbial activity by measuring the release of carbon dioxide (CO2) from the soil. CO2 respiration is a by-product of microbial metabolism, which includes mineralizing nutrients and breaking down residues. This test is a good indicator of overall microbial activity.
The value reported for the soil respiration test is in milligrams of CO2 per gram of dry soil. The higher the value - the better.
Aggregate Stability
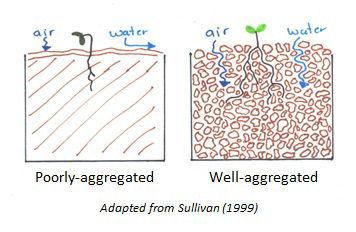
Soils are composed of many shapes and sizes of particles (sand, silt, and clay), and these particles form into structures known as “aggregates.” These aggregates of soil particles are held together by organic matter, microorganisms, and the compounds these microorganisms produce. Having aggregates of different sizes results in spaces (or pores) between the aggregates, which allows water and air to move through the soil. The structural stability of soil is dependent on how well these aggregates are held together and by the types of particles present in the aggregate. Therefore, the presence and durability of aggregates is key to maintaining good soil structure.
A well-aggregated soil is more likely to maintain its structure in response to physical stress such as tillage, precipitation, and compaction. We measure aggregate stability by testing how well soil aggregates resist breaking apart during a simulated heavy rainstorm event. The value reported is in percentage of stable aggregates. The higher the value - the better.
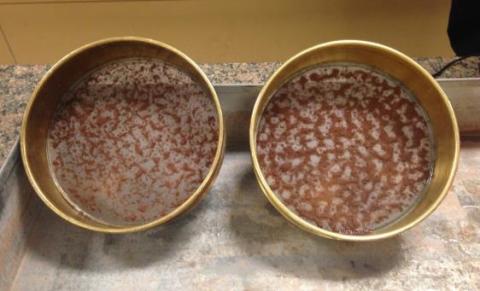
Aggregate Stability Test
On the left, this soil only retained 20% of the soil aggregates on the sieve during the rainfall simulation, whereas the soil on the right retained 63% of the soil aggregates. The higher aggregate stability found in the sample on the right means it will have greater resistance to breakdown during stress (i.e., during extreme weather conditions).
Biological Nitrogen Availability
Nitrogen is stored in the soil in two forms – one is immediately plant available (inorganic), and the other (organic) is tied-up in a variety forms (i.e. in organic matter, microbial organisms, plant and root residues, etc.). Nitrogen becomes plant available when it is broken down (also known as mineralized) into an “inorganic” form, and can then be actively taken up by plant roots. This breakdown process occurs by microbes metabolizing these compounds and releasing nitrogen into a plant available form. This process is driven by microbes and is dependent on soil temperatures and moisture levels.
To measure how well your soil can provide plant-available nitrogen during the growing season, the biological nitrogen availability is tested by taking a dry, relatively inactive soil and exposing it to optimum moisture and temperature conditions over two weeks. This allows microbial activity to resume and the amount of nitrogen that gets mineralized into plant-available forms can be measured. The amount of plant-available (inorganic) nitrogen that is mineralized during this period is reported and the higher the value – the better. This test was adapted for use specifically for PEI producers by the Atlantic Soil Health Lab in Truro, NS.
Soil pH and nutrient availability
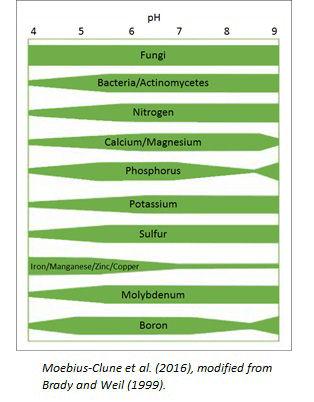
Soil pH measures the acidity of the soil. Soil acidity affects many soil processes, including microbial activity and the availability of nutrients to crops. Optimum soil pH can differ by crop type, with most crops having an optimum of 6.2-6.8. However, potatoes and wild blueberries can grow well in lower pH soils.
The image below depicts the availability of different nutrients at various pH levels. The wider the band, the greater the availability of that nutrient. As pH changes, nutrients take on different chemical forms, making them more or less reactive with other compounds. Therefore, at different pH levels some nutrients are more available, and some nutrients are less available.
Crop growth is largely dependent on ensuring adequate nutrients are taken up by the plant, and can be slowed down if nutrients are not in a plant-available form. Nutrients can be referred to as macronutrients if they are required by the plant in a large volume, and micronutrients if they are required in a small amounts. Soil chemistry is an integral component of soil health, which is why the soil health test is accompanied by a full nutrient analysis. Please consult the S3 report accompanying your soil health test for detailed nutrient results for each of your samples.
Phosphorus Saturation Index
Phosphorus is a relatively immobile nutrient within the soil and can be inaccessible to the crop unless it is in a form available for plant uptake. Factors that affect phosphorus plant uptake include organic matter content, fertilizer placement, and pH. Because PEI has slightly acidic soils, iron and aluminum can chemically tie-up “free” phosphorus that would otherwise be plant available at lower pH values. The Phosphorus Saturation Index is a calculation that can help predict the amount of P available to the crop, by accounting for the total amount of phosphorus and iron within the soil, as well as pH. Refer to the table below to determine if the phosphorus saturation (P/Al %) is above or below the critical P-Saturation level for your pH.
| pH level of your sample | Critical P-Saturation Level | Interpretation |
|---|---|---|
|
pH < 5.5 |
19% | If the P/AL % is above the critical P-saturation level listed for your pH level, then the soil is saturated with excess phosphorus. Therefore, the likelihood that crop yield will be impacted by the addition of phosphorus fertility is very low. Excess phosphorus can cause environmental issues if it moves with soil through erosion to bodies of water. A reduction in your phosphorus fertilization strategy is recommended. |
| pH > 5.5 | 14% |
For more information on the P-Saturation Index, please refer to the factsheet “Understanding the factors controlling phosphorus availability”.
Specific phosphorus recommendations using the phosphorus index for potato has been developed for PEI. The P-saturation index is also used to estimate potato P requirements in Quebec (CRAAQ, 2010), and New Brunswick (New Brunswick Department). These recommendations were developed for PEI soils at plot-scale studies and validation of the recommendations for field-scale is in development. More information
C:N Ratio
Soil microbes decompose organic materials in search of nutrients and energy sources. The relative amounts of energy (C) and nutrients (N, P, S) will determine whether decomposition will result in removal (immobilization) or release of nutrients (mineralization). Organisms will only use the nutrients needed to meet their growth needs, releasing the excess nutrients into the soil in a plant-available form (mineralization).
The ratio of C:N in the soil therefore reflects the relative amounts of energy (C) and nitrogen (N) in organism matter and whether nitrogen mineralization or immobilization will occur during decomposition. When the ratio of C:N falls below 20:1, decomposition will result in plant available nitrogen being released (mineralization).
The C:N ratio for soil is calculated simply by comparing the total carbon and total nitrogen values of the sample, which are reported below the ratio. Greater soil N supply is expected in soils with a narrow C:N ratio.
Available Water Capacity
Available water capacity (AWC) is an important measure in crop management for both irrigated and non-irrigated fields, as it outlines a soil’s ability to retain water. PEI soils are generally of a sandy loam texture, which allows water to percolate from the root zone faster
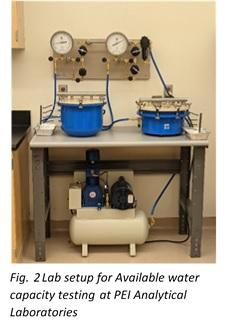
than soils that are heavier in clay or silt, resulting in a more narrow window of available water to roots. As our climate continues to change, water availability concerns can become more pronounced, highlighting the need for an indicator such as the AWC analysis.
AWC is assessed by subjecting a water-saturated soil sample to specific pressures and recording the remaining water weight. The two pressure points (0.1 and 15 Bar) simulate the upper and lower limits of crop accessible water, known as “field capacity” and “permenant wilting point”. Available water capacity is calculated by subtracting the total difference in water weight between these two points. The higher the value - the better.
A soil’s AWC value can be influenced by many other soil parameters apart from soil texture class, including aggregation, bulk density, and organic matter levels. Other ways to promote increased water availability in field include addressing any compaction or drainage issues, as well as keeping the soil covered with mulches or other residues. For more information see the available water capacity fact sheet.
Section II - Crop management considerations for soil health
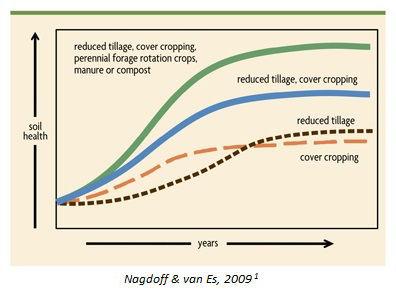
There are several management strategies that are known to improve soil health. These strategies, however, will differ from farm to farm, depending on the management of cropping systems. The strategies that are useful in one situation or season in any given field may not work in another. For example, a reduction in tillage may not be possible during a year that a vegetable crop is in rotation, but there may be opportunities in other years of a vegetable rotation. However, each soil health strategy listed below can be used in some capacity with different farming systems, with adjustments as needed.
Each of these strategies has varying short term and long term impacts on soil health. Soil health strategies employed on farms have an additive effect- the more strategies used over time, the increased likelihood of improving soil health.
Building soil organic matter-
Whenever there is a goal to build or maintain soil organic matter, all of the interactions occurring between farming practices and the soil need to be considered. Each addition, removal, and disturbance imposed on soil can affect soil organic matter. Small actions add up – whether it is the removal of one tillage pass or the addition of one season of ground cover over an entire crop rotation.
As previously stated, soil organic matter contributes to several beneficial soil functions such as: improved drainage, increased nutrient and water holding capacity, higher microbial activity, greater cation exchange capacity, increased water and air exchange, and improved resistance to extreme weather. Many of the following soil health strategies are related to best management practices (BMP’s) that help maintain or build soil organic matter.
Addition of manures and other soil amendments-
By adding organic inputs, you are positively impacting the soil and ultimately the crop. Inputs such as manures, composts or green manures add carbon and other elements into the system that act as energy for the microbial community. Amendments that have a high nutrient content (such as green manures and crop residues) help add to soil organic matter as they are broken down, and can have an increased impact on soil structure (forming and maintaining soil aggregates) over time.
Maintaining living roots in the soil for as long as possible-
By maintaining living ("green") crops as long as possible throughout the growing season, you are:
- producing more plant matter that can be re-incorporated into the soil
- providing a food source to many microbial organisms
- actively sequestering carbon and nitrogen into the plant that can later be released into the soil.
By ensuring the crop is staying alive longer, you are decreasing the amount of time that the crop can be decomposed or deteriorated due to microbial activity and weathering. Strategies such as delayed tillage or delayed chemical termination of a crop can be employed to help prolong these benefits.
Keeping soil covered-
By keeping soil covered with a cover crop throughout the winter months, or a nurse crop during the growing season, you can reduce the amount of soil that is lost to wind and water erosion. Leaving soil bare and vulnerable to erosion at any point in the year could negate other beneficial soil practices that are being used to increase soil health.
Using diverse crops with increased residues-
Soils that are cropped repeatedly with the same crop types from one year to the next, or with the repeated same rotation can be deteriorating to soil health. With repeated use of crops, soils can develop disease problems as soil pathogens can accumulate over time. Nutrients taken up by a crop over time and harvested can also cause nutrient depletion as many crops take up preferential sources of nutrients over time, exhausting the nutrient source within the soil.
When assessing needs of individual fields based on their soil health test values, it may be beneficial to group specific fields together that have similar or consistent issues, and approach crop diversification by including beneficial crops within those fields once in the next few rotation cycles to influence some change to the nutrient pools and pathogen communities.
Residue management is essential when considering rotation crops. Crops that contribute greater amounts of residues to decompose will feed soil microbes, promote organic matter build-up, and help the soil retain moisture. Therefore, when choosing diverse crops to include in rotations, the impact will be more significant when selecting crops that have properties that are beneficial to soil health.
Reduction in tillage-
Each tillage operation that occurs on soil adds oxygen to the system, increasing carbon mineralization and loss of CO2 to the atmosphere. Additionally, the force of tillage causes soil aggregates to break apart, which negatively impacts soil structure. When soil aggregates are broken into smaller and finer units, organic matter becomes more susceptible to breakdown and being lost. Furthermore, repetitive tillage at the same depth can cause compaction issues such as 'smearing' at the depth of the plow, creating a hard layer in the soil, commonly referred to as a plowpan. The reduction of one pass at a minimum each year could lead to a larger reduction in passes over the entire rotation and have a longterm effect on increasing aggregate size and stability, and retaining and building soil organic matter.
Addressing compaction
Compaction can diminish a plant’s ability to uptake water and nutrients, reduces the soil’s natural erosion defence, and ultimately can result in a sub-optimal crop. Any repeated soil disturbance, through tillage or vehicle traffic can have a negative effect on soil structure, potentially causing and exacerbating compaction. As island soils are generally coarse, compaction issues are usually less severe than other soil types and can more reasonably be addressed on a management level. Reducing tillage and keeping vehicle traffic to dedicated laneways are some ways to attempt to address and mitigate for compaction.
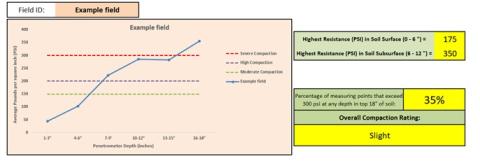
Compaction can be assessed on farm in multiple ways. The simplest method is to dig a pit in the area in question and feel for changes in the soil structure. This can give an indication on the depth and main cause of compaction. Penetrometers are a more precise method to assess compaction in the field and can be loaned out free of cost at PEI Analytical Labs. These units use a pressure gauge to give a value in PSI, which is directly tied to the efficiency of plant root development. PEIDA has recently developed an input tool, as well as several fact sheets on understanding, measuring, and addressing compaction on farm. See our fact sheet on compaction and soil health to learn more.
This factsheet was prepared by Kyra Stiles, Hardy Strom and Bradford Rooney (Sustainable Agriculture Section, PEI Department of Agriculture).
For more information on soil health testing, contact:
PEI Analytical Laboratories
(902) 620-3300
References:
Brady, N.C. and Weil, R.R., 2008. The nature and properties of soils. Upper Saddle River: Pearson Prentice Hall. Print.
CRAAQ, 2010. Centre de référence en agriculture et agroalimentaire du Quebec (CRAAQ), 2nd edition. Fertilization reference guide (in French). CRAAQ, Ste-Foy, QC, Canada.
Moebius-Clune, B.N., D.J. Moebius-Clune, B.K. Gugino, O.J. Idowu, R.R. Schindelbeck, A.J. Ristow, H.M. van Es, J.E. Thies, H.A. Shayler, M.B. McBride, K.S.M Kurtz, D.W. Wolfe, and G.S. Abawi, 2016. Comprehensive Assessment of Soil Health – The Cornell Framework, Edition 3.2, Cornell University, Geneva, NY.
Nagdoff, F. and van Es, H., 2009. Building Soils for Better Crops, 3rd edition. Fred Magdoff and Harold van Es. 2009.
New Brunswick Department of Agriculture, 2010. Modifications for the soil test report and new phosphorus fertilization table for potatoes-2011.
Ontario Ministry of Agriculture, Food and Rural Affairs, [date unknown]. Best management practices: Adding organic amendments.
Ontario Ministry of Agriculture, Food, and Rural Affairs, [date unknown]. No-till for soil health.
Sullivan, P., 1999. Sustainable soil management: Soil system guide. ATTRA, Fayetteville, AK.
1Excerpted with permission from Building Soils for Better Crops, 3rd ed., published by Sustainable Agriculture Research and Education (SARE) Outreach, USDA - National Institute of Food and Agriculture (NIFA). Citation of SARE materials does not constitute SARE’s or USDA's endorsement of any product, organization, view or opinion. More information about SARE and sustainable agriculture.
