Gross Domestic Product (GDP) by Income and Expenditure
On November 6, 2025 Statistics Canada released preliminary Provincial Gross Domestic Product (GDP) by Income and Expenditure data for 2024 and revisions for 2022 and 2023.
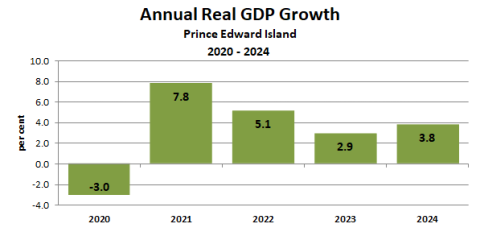
Real GDP1 at Market Prices (Income and Expenditure Accounts)
Canada’s real gross domestic product (GDP) grew 2.0 percent in 2024, the same rate as in 2023. Growth in real GDP was driven by increases in household spending, government final consumption expenditure, and exports. Real GDP rose in all provinces and Nunavut, while Yukon and Northwest Territories recorded declines. Among the provinces, Prince Edward Island (3.8 percent), Nova Scotia (3.1 percent), Saskatchewan (3.0 percent), and Alberta (3.0 percent) had the largest annual increases in GDP. By this measure, the revised data shows the PEI economy grew by 5.1 percent in 2022, revised up from 4.4 percent, and by 2.9 percent in 2023, revised up from 2.2 percent.
PEI’s GDP at market prices in current dollars (Nominal GDP4) was valued at $10.9 billion in 2024, an increase of 7.5 percent over 2023.
Diagram 1 illustrates provincial economic growth from 2020 to 2024 in chained 2017 dollars.
As Table 1 indicates, the national economy expanded by 2.0 percent in chained 2017 dollars in 2024, matching the increase in 2023. Nunavut saw the highest growth among provinces and territories in 2024 with an increase of 6.9 percent, followed by Prince Edward Island at 3.8 percent and Nova Scotia at 3.1 percent. Real GDP increased in all 10 provinces and Nunavut in 2024, with Yukon and Northwest Territories posting declines.
TABLE 1 - REAL GDP CHANGE, CANADA, PROVINCES AND TERRITORIES, 2020 - 2024
| Real GDP Change (%) | |||||
| (Chained $ 2017) | |||||
| Province/Territory | 2020 | 2021 | 2022 | 2023 | 2024 |
| Newfoundland and Labrador | -4.8 | 1.0 | -1.1 | -3.0 | 2.7 |
| Prince Edward Island | -3.0 | 7.8 | 5.1 | 2.9 | 3.8 |
| Nova Scotia | -4.5 | 6.4 | 5.1 | 2.4 | 3.1 |
| New Brunswick | -3.6 | 5.3 | 2.2 | 2.0 | 2.7 |
| Quebec | -4.7 | 7.3 | 4.5 | 0.7 | 1.7 |
| Ontario | -4.5 | 6.1 | 4.4 | 2.4 | 1.6 |
| Manitoba | -4.1 | 1.4 | 4.8 | 2.8 | 1.7 |
| Saskatchewan | -4.3 | -2.6 | 10.1 | 3.1 | 3.0 |
| Alberta | -7.8 | 5.2 | 5.9 | 2.5 | 3.0 |
| British Columbia | -3.1 | 7.7 | 4.8 | 2.8 | 1.1 |
| Yukon | 1.7 | 9.4 | 3.1 | 1.3 | -2.5 |
| Northwest Territories | -9.0 | 3.4 | -0.5 | 0.5 | -0.8 |
| Nunavut | 2.3 | 6.6 | 2.8 | 3.6 | 6.9 |
| Canada | -5.0 | 6.0 | 4.7 | 2.0 | 2.0 |
Growth in Prince Edward Island was led by gross fixed capital formation, which increased by 10.4 percent in 2024, following a 5.7 percent decrease in 2023. The increase was driven mainly by an 18.2 percent increase in residential structures.
PEI’s exports increased 2.0 percent in 2024, while growth in imports2 increased 1.3 percent, resulting in a positive impact on GDP.
Investment in inventories also contributed to growth, in particular business non-farm inventories, which contributed 0.9 percentage points to GDP growth.
Final consumption expenditure increased by 0.7 per cent in 2024, following a 2.1 per cent increase in 2023, and contributed 0.7 percentage points to GDP growth. The increase was driven mainly by a 1.8 per cent increase in general governments final consumption expenditure.
Table 2 shows PEI’s expenditure based real GDP in chained 2017 dollars from 2019 to 2023.
TABLE 2 - REAL GDP, EXPENDITURE BASED (CHAINED 2017 DOLLARS), PRINCE EDWARD ISLAND, 2024
| in $ millions (except per capita) | 2020 | 2021 | 2022 | 2023 | 2024 |
| Chained 2017 dollars | |||||
| Final consumption expenditure | 6,863 | 7,419 | 7,736 | 7,899 | 7,957 |
| Household final consumption expenditure | 4,577 | 4,994 | 5,207 | 5,292 | 5,298 |
| Goods | 2,218 | 2,429 | 2,418 | 2,384 | 2,401 |
| Services | 2,359 | 2,565 | 2,792 | 2,916 | 2,904 |
| Non-profit institutions serving households' final consumption expenditure | 101 | 107 | 120 | 130 | 137 |
| General governments final consumption expenditure | 2,182 | 2,316 | 2,406 | 2,475 | 2,520 |
| Gross fixed capital formation | 1,511 | 1,728 | 1,687 | 1,590 | 1,756 |
| Business gross fixed capital formation | 1,129 | 1,285 | 1,255 | 1,139 | 1,248 |
| Residential structures | 624 | 709 | 670 | 523 | 618 |
| Non-residential structures, machinery and equipment | 422 | 484 | 484 | 520 | 528 |
| Intellectual property products | 83 | 92 | 105 | 110 | 113 |
| Non-profit institutions serving households' gross fixed capital formation | 9 | 10 | 10 | 11 | 12 |
| General governments gross fixed capital formation | 375 | 437 | 425 | 449 | 507 |
| Investment in inventories | -49 | 69 | 40 | -21 | 46 |
| Of which: business investment in inventories | -49 | 68 | 43 | -23 | 44 |
| Non-farm | -23 | -36 | 68 | 8 | 90 |
| Farm | -25 | 93 | -21 | -23 | -27 |
| Exports of goods and services | 3,219 | 3,416 | 3,698 | 3,959 | 4,038 |
| Exports to other countries | 1,597 | 1,613 | 1,828 | 2,063 | 2,043 |
| Exports to other provinces | 1,618 | 1,802 | 1,863 | 1,882 | 1,986 |
| Less: imports of goods and services | 4,562 | 5,101 | 5,227 | 5,256 | 5,322 |
| Imports from other countries | 1,510 | 1,795 | 1,996 | 2,004 | 2,036 |
| Imports from other provinces | 3,054 | 3,308 | 3,242 | 3,263 | 3,297 |
| Statistical discrepancy | 5 | 6 | 3 | 6 | 2 |
| Gross domestic product at market prices | 7,003 | 7,552 | 7,940 | 8,174 | 8,482 |
| Final domestic demand | 8,375 | 9,151 | 9,420 | 9,479 | 9,715 |
| Annual Growth in Gross Domestic Product (%) | -3.0 | 7.8 | 5.1 | 2.9 | 3.8 |
| Gross Domestic Product Per Capita (chained 2017 $) | 44,951 | 47,439 | 48,972 | 48,884 | 48,828 |
| Change in Real GDP Per Capita (%) | -5.2 | 5.5 | 3.2 | -0.2 | -0.1 |
| Nominal GDP | 7,461 | 8,567 | 9,499 | 10,134 | 10,889 |
| Nominal GDP Per Capita ($) | 47,891 | 53,815 | 58,588 | 60,605 | 62,684 |
| Change in Nominal GDP Per Capita (%) | -2.0 | 12.4 | 8.9 | 3.4 | 3.4 |
Table 3 shows contributions to change3 in real GDP for 2024. Final consumption expenditure, the largest component of GDP, contributed 0.7 percentage points. Services deducted 0.1 percentage points from the final consumption expenditure component, while general governments final consumption expenditure added 0.5 percentage points. Gross fixed capital formation contributed 2.2 percentage points. An increase in investment in inventories increased GDP growth by 0.8 percentage points in 2024. Exports of goods and services added 1.0 percentage point while imports of goods and services also increased, deducting 0.8 percentage points from GDP growth, for a total net gain of 0.2 percentage points for international and interprovincial trade.
TABLE 3 - REAL GDP, EXPENDITURE BASED, CONTRIBUTIONS TO PERCENT CHANGE, PRINCE EDWARD ISLAND, 2024
| Gross domestic product (GDP) | 3.8 | Gross Fixed Capital Formation | 2.2 |
| Final consumption expenditure | 0.7 | Business gross fixed capital formation | 1.5 |
| Durable goods | 0.2 | Residential structures | 1.3 |
| Semi-durable goods | -0.0 | Non-residential structures | 0.2 |
| Non-durable goods | 0.0 | Machinery and equipment | -0.1 |
| Services | -0.1 | Intellectual property products | 0.0 |
| Non-profit institutions final consumption expenditure | 0.1 | Non-profit institutions gross fixed capital formation | 0.0 |
| General governments final consumption expenditure | 0.5 | General governments gross fixed capital formation | 0.7 |
| Exports of goods and services | 1.0 | Investment in inventories | 0.8 |
| Exports to other countries | -0.3 | Non-farm | 0.9 |
| Exports to other provinces | 1.2 | Farm | -0.1 |
| Deduct: Imports of goods and services | 0.8 | Statistical discrepancy | -0.1 |
| Imports from other countries | 0.4 | ||
| Imports from other provinces | 0.4 | Final domestic demand | 2.8 |
Nominal GDP
Nominal GDP in 2024 increased in 11 provinces and territories, with a 4.2 percent decline in the Northwest Territories and virtually no change in Saskatchewan. National nominal GDP increased 4.8 percent with Nunavut (15.7%), Nova Scotia (8.0%), and Prince Edward Island (7.5%) leading jurisdictions. The national GDP implicit price index5 rose 2.8 percent, while PEI's GDP implicit price index rose 3.5 percent in 2024. Table 4 shows the change in nominal GDP for Canada, the provinces and territories.
TABLE 4 - NOMINAL GDP CHANGE, CANADA, PROVINCES AND TERRITORIES, 2020 - 2024
| Nominal GDP Change (%) | Nominal GDP | ||||||
| (Current dollars) | 2024 | ||||||
| Province/Territory | 2020 | 2021 | 2022 | 2023 | 2024 | $ millions | |
| Newfoundland and Labrador | -10.2 | 20.2 | 8.7 | -4.0 | 4.6 | 42,219 | |
| Prince Edward Island | 0.3 | 14.8 | 10.9 | 6.7 | 7.5 | 10,889 | |
| Nova Scotia | -1.4 | 11.3 | 9.4 | 7.6 | 8.0 | 65,338 | |
| New Brunswick | -1.8 | 10.5 | 8.8 | 3.5 | 4.0 | 48,302 | |
| Quebec | -1.8 | 12.4 | 9.6 | 4.7 | 5.9 | 616,771 | |
| Ontario | -2.1 | 11.0 | 9.8 | 6.9 | 5.1 | 1,197,020 | |
| Manitoba | -2.2 | 8.7 | 11.3 | 5.4 | 3.3 | 96,125 | |
| Saskatchewan | -8.0 | 13.6 | 32.7 | -3.7 | -0.0 | 112,839 | |
| Alberta | -14.4 | 26.1 | 23.7 | -4.0 | 5.1 | 473,937 | |
| British Columbia | -0.5 | 16.1 | 12.1 | 3.6 | 3.5 | 429,089 | |
| Yukon | 5.4 | 12.2 | 6.5 | 8.0 | 4.0 | 4,349 | |
| Northwest Territories | -10.2 | 14.0 | 11.7 | 0.1 | -4.2 | 5,123 | |
| Nunavut | 13.4 | 8.7 | -0.4 | 11.3 | 15.7 | 5,668 | |
| Canada | -4.0 | 14.2 | 12.9 | 3.5 | 4.8 | 3,108,551 | |
Notes:
1 Real gross domestic product (GDP) is GDP given in constant prices and refers to the volume level of GDP. Constant price estimates of GDP are obtained by expressing values of all goods and services produced in a given year, expressed in terms of a base period.
2 Imports are a deduction from GDP. An increase in imports results in a negative contribution to change.
3 Contributions to percent change are presented as percentage points.
4 Nominal gross domestic product (GDP) is GDP given in current prices, without adjustment for inflation.
5 The GDP implicit price index reflects the overall price of domestically produced goods and services.
Source: Statistics Canada.
Table 36-10-0222-01 Gross domestic product, expenditure-based, provincial and territorial, annual (x 1,000,000)
Table 36-10-0223-01 Implicit price indexes, gross domestic product, provincial and territorial
released November 6, 2025.
Related downloads for this release:
Annual GDP By Income and Expenditure report (246 KB)